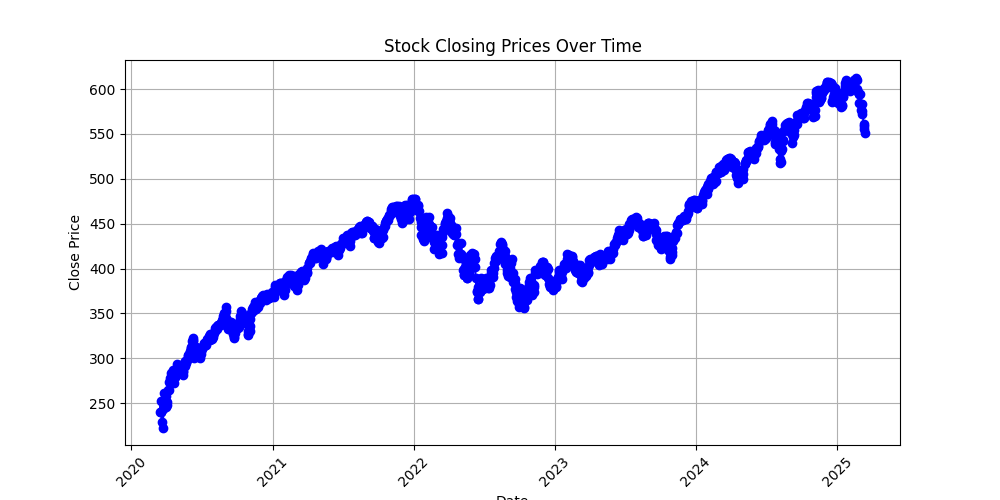
Stock Data Analysis Report
Summary Statistics
|
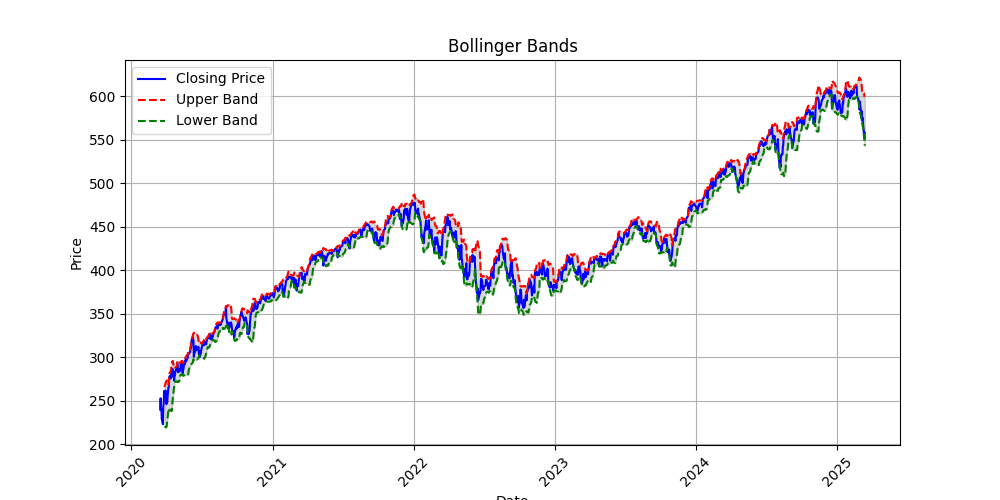
Close/Last |
Volume |
Open |
High |
Low |
Daily_Return |
SMA_10 |
EMA_10 |
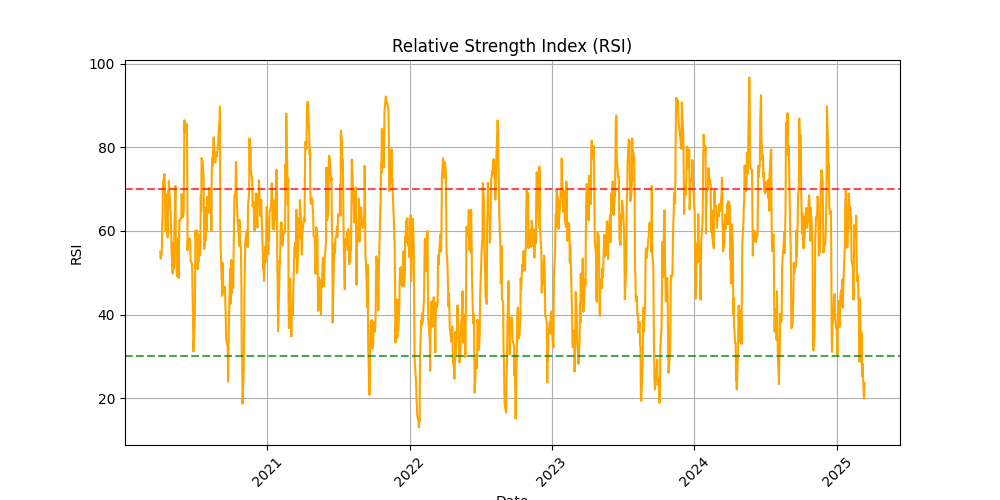
RSI |
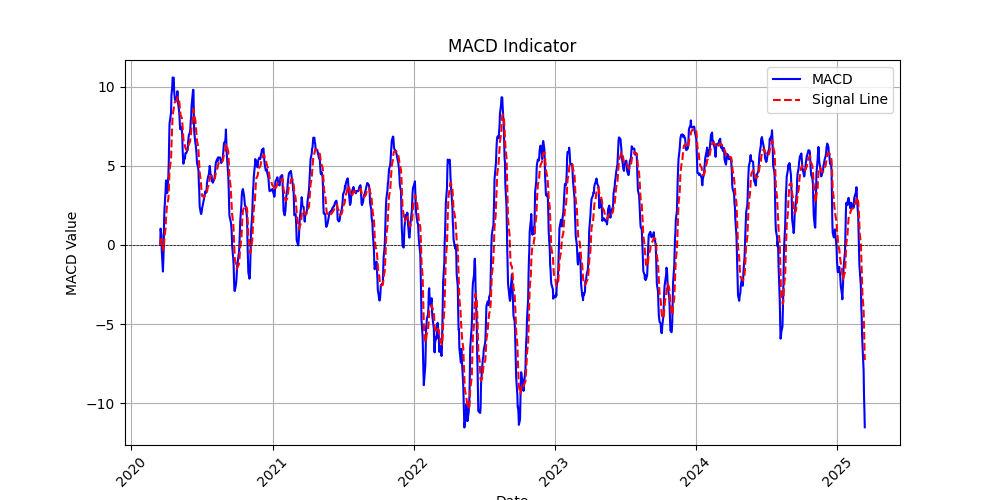
MACD |
MACD_Signal |
Upper_Band |
Lower_Band |
| count |
1256.00 |
1.256000e+03 |
1256.00 |
1256.00 |
1256.00 |
1255.00 |
1247.00 |
1256.00 |
1243.00 |
1256.00 |
1256.00 |
1247.00 |
1247.00 |
| mean |
435.61 |
7.892778e+07 |
435.56 |
438.12 |
432.75 |
0.07 |
435.85 |
434.43 |
56.38 |
1.96 |
1.99 |
446.60 |
425.11 |
| std |
79.86 |
3.609665e+07 |
79.96 |
79.69 |
80.00 |
1.18 |
78.70 |
80.01 |
15.97 |
4.27 |
3.92 |
78.71 |
79.07 |
| min |
222.95 |
2.604871e+07 |
228.19 |
229.68 |
218.26 |
-5.76 |
242.95 |
236.28 |
12.99 |
-11.52 |
-10.30 |
265.84 |
219.21 |
| 25% |
388.63 |
5.592571e+07 |
387.26 |
390.62 |
384.94 |
-0.52 |
388.40 |
387.55 |
44.57 |
-0.38 |
-0.16 |
399.74 |
375.59 |
| 50% |
427.85 |
7.271274e+07 |
426.98 |
429.63 |
424.85 |
0.09 |
427.88 |
428.30 |
57.98 |
2.96 |
2.89 |
439.47 |
417.18 |
| 75% |
470.81 |
9.249362e+07 |
471.65 |
473.04 |
468.54 |
0.73 |
470.82 |
469.95 |
67.30 |
5.19 |
4.96 |
479.96 |
463.15 |
| max |
612.93 |
3.471588e+08 |
611.54 |
613.23 |
609.56 |
9.06 |
607.48 |
608.13 |
96.72 |
10.57 |
9.33 |
621.69 |
602.08 |
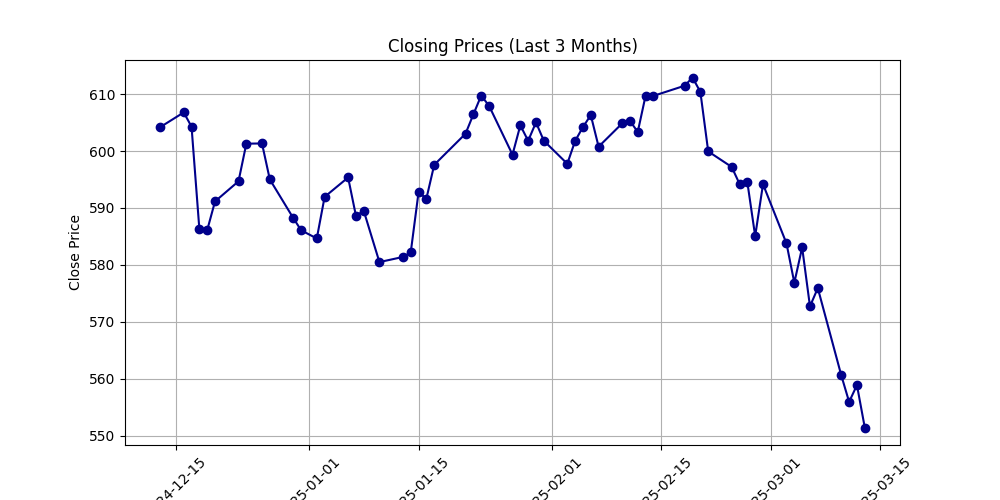
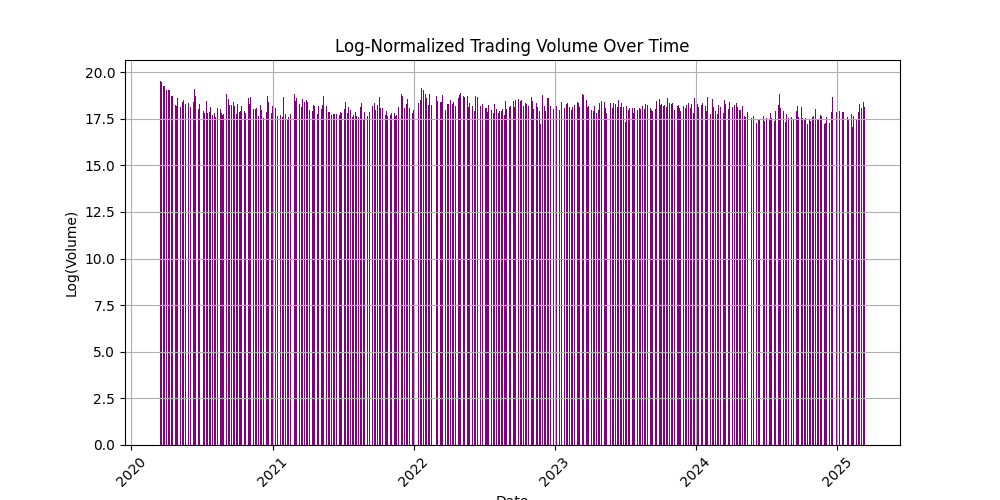
Charts